Department of Science and Technology
Philippine Atmospheric, Geophysical and
Astronomical Services Administration
Astronomical Services Administration
Philippine Standard Time
01:45:25 PM
8 August 2025
The Climate Impact Assessment for Philippine Agriculture has been regularly issued by the DOST-PAGASA since its inception in the mid-1980s. It contains an assessment of the weather and climate systems that prevailed in the past month that could potentially affected the rice and corn crops, as well as the farm-related activities across the different regions of the country. DOST-PAGASA believes that this report might be useful for agriculturists, policymakers, farmers, and their advisers (e.g., agricultural extension workers and agricultural technicians) in assessing the potential adverse impacts of an extreme event (e.g., drought, heavy rainfall, and tropical cyclone occurrence) to existing crops and to subsequently formulate effective adaptation response.
Jose (1982) conceptualized the Report in consideration of the state-of-the-art methods for agricultural assessment and farm advisory formulation during the 1980s. The report has been regularly issued since January 1985 and was originally designed to derive information from in-situ observation, specifically, data collected from meteorological stations of DOST-PAGASA. In 2021, the Report underwent considerable enhancement in an attempt to start aligning its content with that of contemporary global and regional scale agricultural monitoring systems (Fritz et al., 2019).
Starting from the 1st Issue of the 38th volume of the Report (i.e., Assessment for January 2022), the information provided has been entirely based on satellite-derived products. The primary reason for switching from using surface observations to satellite-derived products is the spatial scarcity of the former, while the latter's spatial and temporal completeness makes the Report more relevant and representative of the present conditions of rice and corn farms in the Philippines. In addition, the auxiliary farm data (i.e., crop cycle, crop location, soil characteristics) used in formulating the Report were also updated based on the latest research and recognized scientific facts. Furthermore, given the considerable impacts of drought and flood hazards on local agriculture (Israel & Briones, 2012), the drought monitoring indices were replaced with a contemporary version, and additional indices that could indicate potential flood-related crop damage were included.
Further revisions have been done starting the 1st Issue of Volume 39 (i.e., assessment for the month of January 2023), particularly in the computation of rainfall sufficiency, please see the details in the succeeding sections. Crop condition index based on farm water requirement (for rice) and crop water requirement (for corn) was employed to assess the effective rainfall for each crop stages for both rice and corn crops.
Derived Information from Satellite Imagery
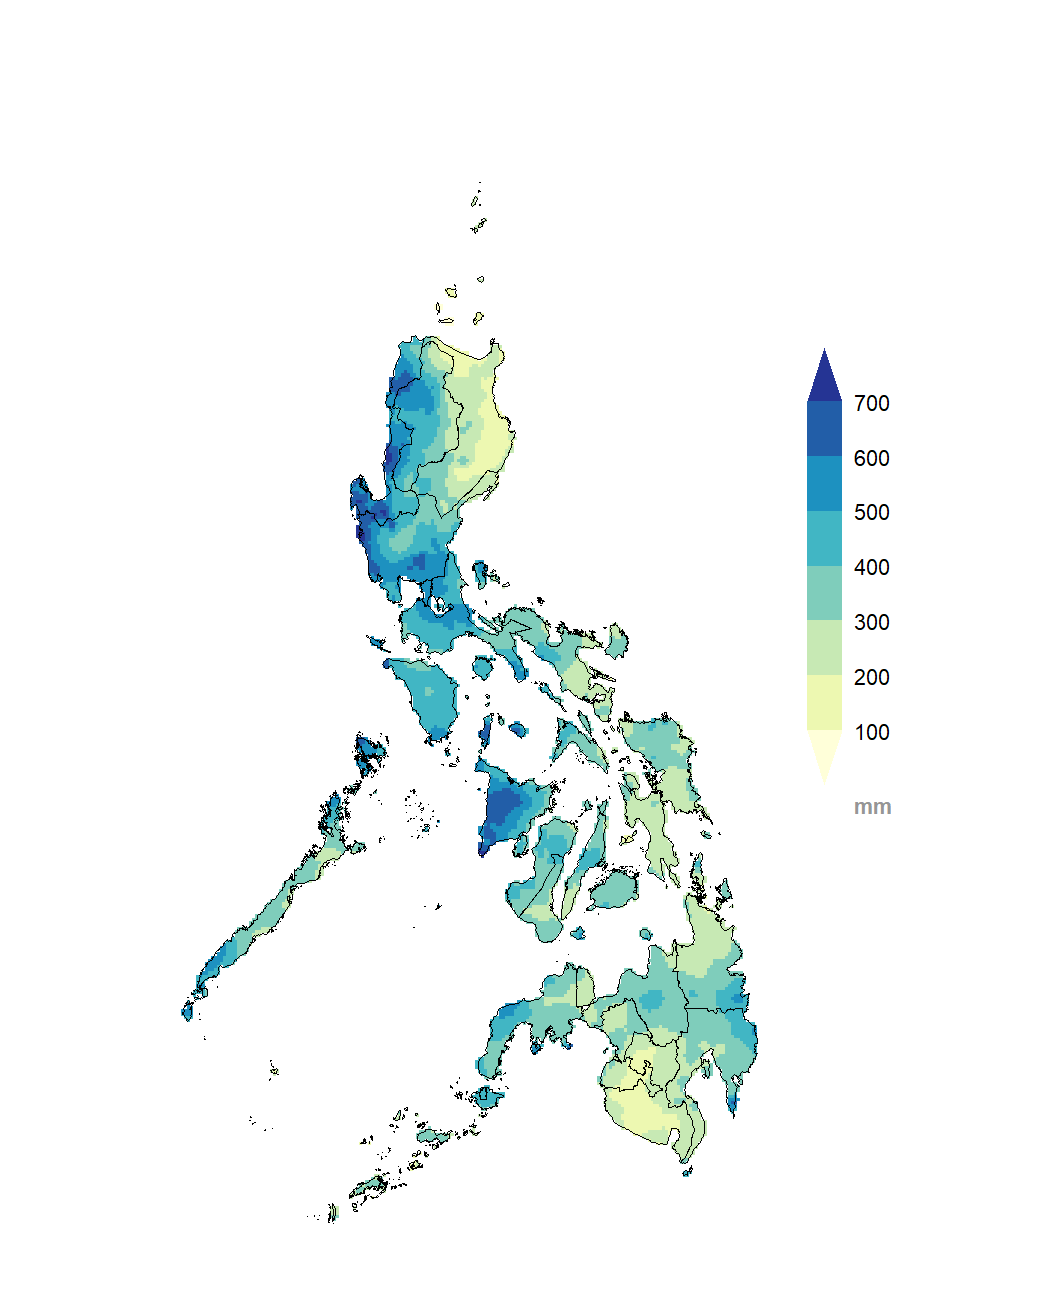
Satellite images (SI) are invaluable sources of meteorological and environmental variables for countries characterized with complex topography, yet have a sparse network of land-based observation systems. Using SI, farm areas in the country that are considerably distant from PAGASA synoptic stations can now be provided with farm-relevant weather and climate data. First of the SI-derived information used in this report is the rainfall estimates from the Global Precipitation Measurement (GPM) Level 3 data. Specifically, the Integrated Multi-satellitE Retrievals for GPM (IMERG) Late Run provided in daily timescale at ~10km horizontal grid spacing (GPM_3IMERGDL; Huffman, et.al., 2019), is used for rainfall estimates.
This report also uses the Normalized Difference Vegetation Index (NDVI) and Land Surface Temperature (LST) data from the Terrra Moderate Resolution Imaging Spectroradiometer (MODIS/Terra), which are both at monthly time scale and ~5km spatial resolution. In Asia alone, NDVI is a popular agricultural index and has been widely used in support to rice farming activities, such as mapping of farm areas (Li et al., 2020; Park et al., 2018), identification of rice phenology (Onojeghuo et al., 2018), yield estimation (Liu et al., 2015; Wang et al., 2013), generation of crop calendar (Gutierrez et al., 2019; Mishra et al., 2021), and agricultural drought monitoring (Sholihah et al., 2016). Currently, this Assessment uses NDVI to roughly assess the condition of mature crops. Meanwhile, LST is combined with rainfall estimates in the determination of crop water requirements and in the computation of a drought monitoring index.
Auxiliary Data
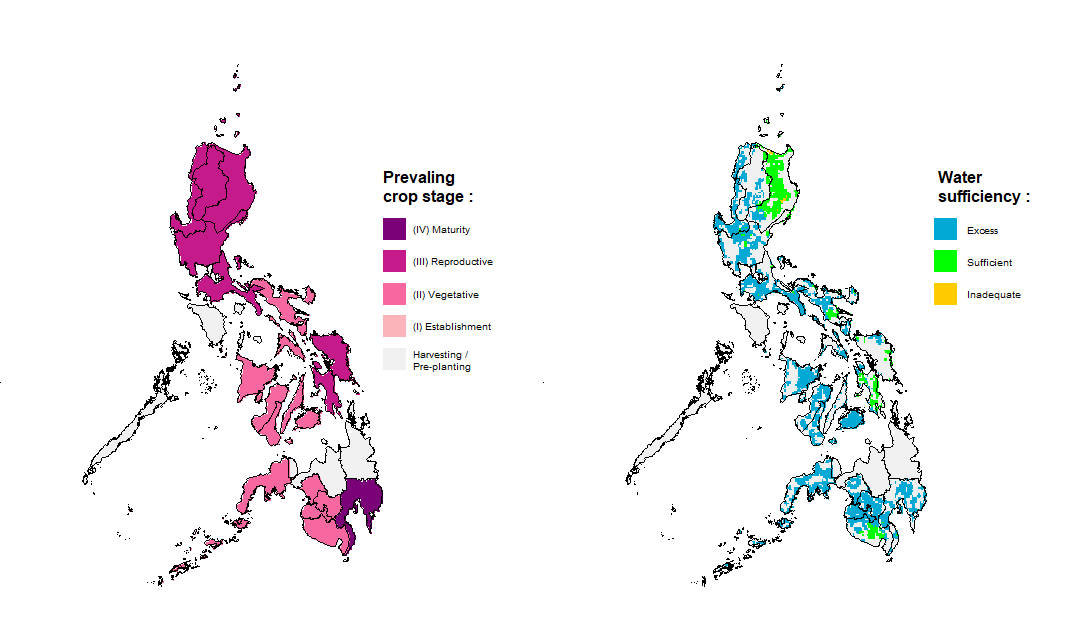
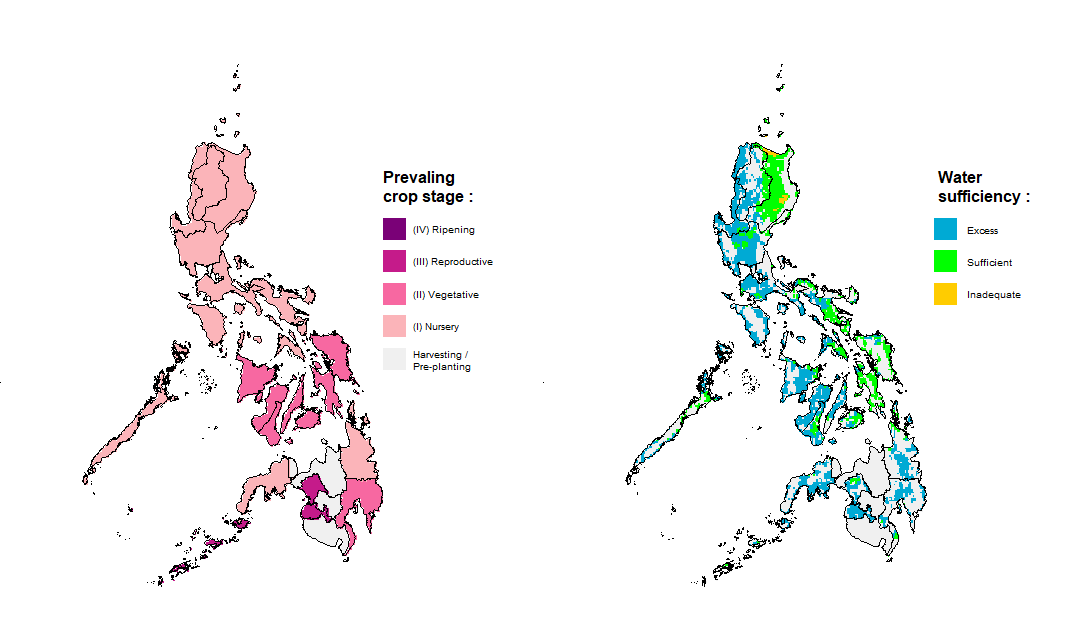
In earlier volumes of this report, assessments were formulated based on the prominent crop cycle over Bicol, and the Visayas Regions in the 1980s (Jose, 1982). Since the Assessment is prepared for all provinces and regions of the Philippines, this naturally led to some degree of uncertainty in the information provided for other areas of the country. This has been resolved in the current version of the report as the cropping calendar for rice and corn in the regions of the Philippines was based on recently published scientific papers. The prevailing cropping stages of rice and corn for a particular month are identified based on the findings of Gerpacio et al. (2004) and Gutierrez et al. (2019).
Crop water requirement and farm water requirement vary in each stage of a crop. Here, the crop water requirement for corn is computed based on the stage-specific crop coefficient identified by Gonzales et al., (2019). For rice, the crop coefficients are based on the study of David (1983) and as recommended by the Philippine National Standards for Irrigation Water Requirement of lowland rice (PNS/BAFS/PAES, 2017). Accurate identification of rice and corn farm areas is also necessary to properly interpret spatial images, such as the NDVI. For this, the Assessment employed a masking process for rainfed rice and corn farms and irrigated rice farms in the Philippines for relevant spatial maps.
Crop Water Requirement, Farm Water Requirement, and Crop Condition Index
Along with precipitation, evapotranspiration is also a necessary factor to consider when determining the available moisture for crops in each of the growing months given that the average atmospheric temperature in the Philippines has been steadily rising amid climate change (PAGASA, 2018). Following the Philippine National Standards (2017) recommended computation for crop water requirement (CWR) is obtained as follows:
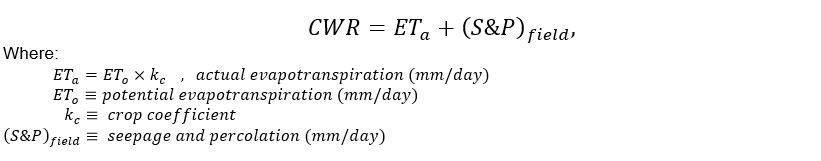
Currently, the potential evapotranspiration is obtained using the method described by Thornthwaite (1948) with the gridded monthly LST data as input. Crop coefficient is identified for each stage of rice and corn, as discussed in Auxiliary Data. The percolation values are provided by the Philippine National Standards (2017) for each soil type, which can be determined spatially for various areas (i.e., applied per province) in the Philippines using the Soil Type Vector Dataset of the Bureau of Soils and Water Management (downloadable from https://www.geoportal.gov.ph). Since both the input LST and the CWR are in a monthly timescale, the aforementioned equations have been modified accordingly.
According to the equation from the Philippine National Standards (2017), the farm water demand (FWR) for the rice crop is calculated as the sum of the CWR for rice, the Land Preparation Water Requirement (LPWR), and effective ditch and losses minus the effective rainfall. This report considers both rainfed and irrigated areas, therefore we revised the equation where the application efficiency and some irrigation-related variables were not taken into consideration and were obtained as follows:
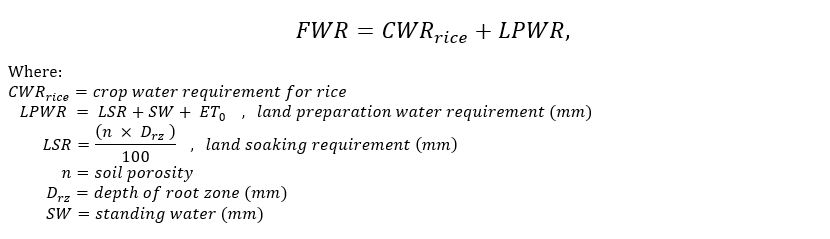
The soil porosity (n) for each soil type at various areas (i.e., applied per province) was determined based on the values in the Philippine National Standards (2017) using the Soil Type Vector Dataset mentioned earlier. Also, the depth of the root zone (D_rz) and standing water (SW) values were given in the Philippine National Standards (2017).
The Crop Condition Index (CCI) at the provincial level is identified for each crop stage (prevailing crop stage at the grid point level) of both rice and corn using the computed FWR (for rice), CWR (for corn), and the total rainfall supply (RS) from the satellite-derived rainfall estimates were obtained as follows:
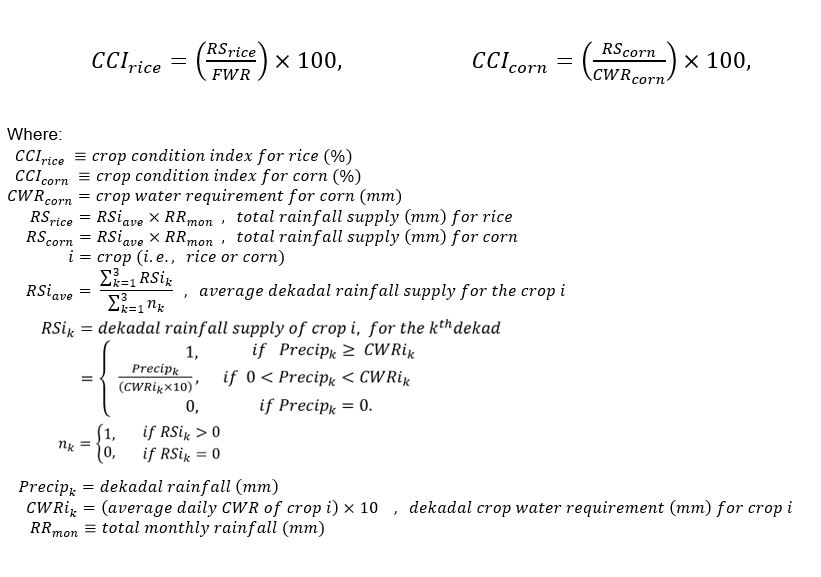
The total rainfall supply represents the effective rainfall determined based on the method mentioned in the Philippine National Standards (2017) modified for the daily rainfall estimates.
Then, the resulting CCI is used as an indicator to categorize accumulated monthly rainfall amount based on the following criteria:

Drought and Heavy Rainfall Indices
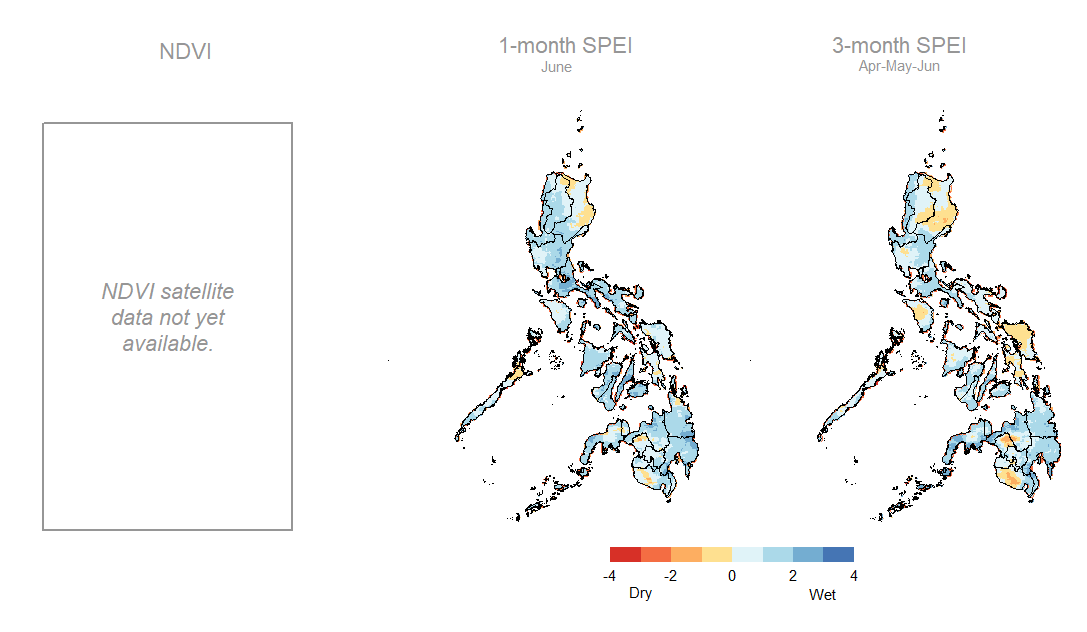
The Standardized Precipitation Index (SPI; McKee et al., 1993) is a powerful drought monitoring index recognized by scientists from around the world and by the World Meteorological Organization (WMO, 2012). A variation of the SPI is the Standardized Precipitation-Evapotranspiration Index (SPEI; Vicente-Serrano et al., 2010), that takes into account the water balance condition, and thus, is useful for detecting agricultural drought events (Mie et al., 2021; Prabnakorn et al., 2016; K. Wang, 2021). The SPI User Guide (WMO, 2012) suggests the use of the 1-month SPEI and the 3-month SPEI for meteorological and agricultural drought monitoring, respectively. Here, we provide the gridded maps of both the 1- and 3-month SPEI to detect the possible occurrence of both the meteorological and agricultural drought conditions.
As previously stated, heavy rainfall events can also affect the rice and corn crops. Hence, heavy rainfall events represented by the maximum 1-day (RX1day) and 5-day (RX5day) rainfall in a given month are included in the current version of the report. Both the RX1day and RX5day indices are part of the 27 Core Indices suggested by the Expert Team on Climate Change Detection and Indices (ETCCDI).
The above-mentioned indices are presented on spatial maps and careful interpretation of the results are discussed for each of the regions comprising the provinces of the country. An overall picture of the assessment covering the entire country is also provided.
JORYBELL A. MASALLO
Chief, Impact Assessment and Applications Section (IAAS)
Climatology and Agrometeorology Division (CAD), DOST-PAGASA
Trunkline No.: (02)8284-0800 (Loc. 4910)
E-mail: iaascad17@gmail.com