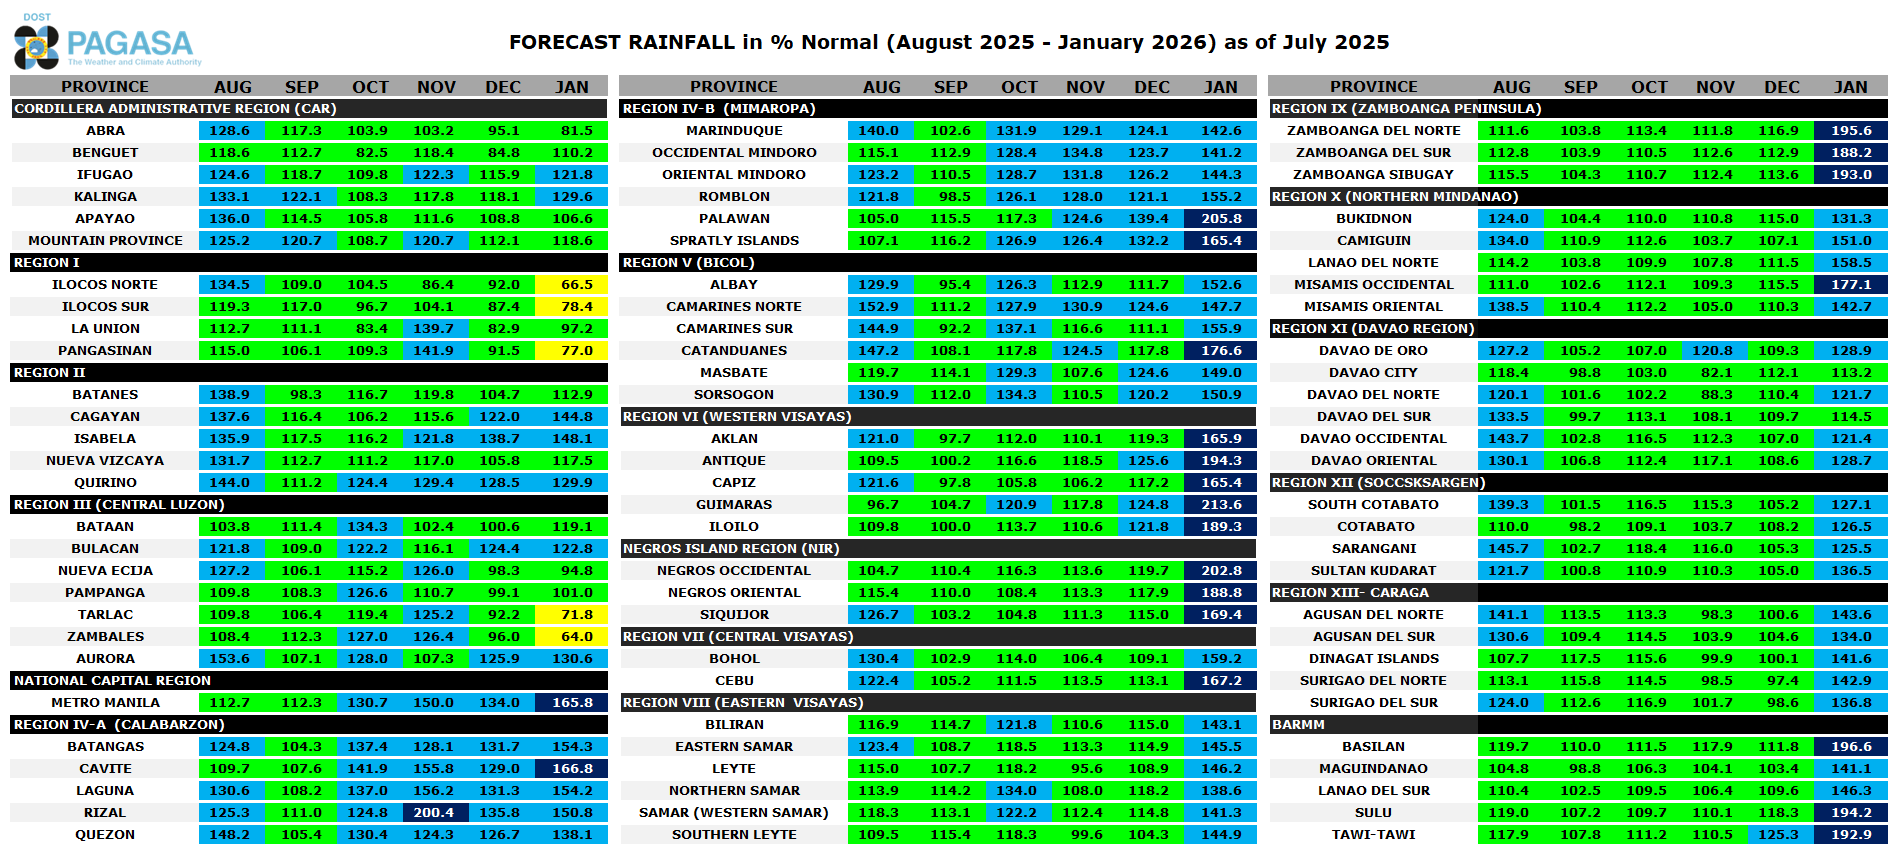
About our Rainfall Maps
| PERCENTAGE (%) | RAINFALL CONDITION |
|---|---|
| Less than or = 40 | way below normal |
| 41 - 80 | below normal |
| 81 - 120 | near normal |
| Greater than 120 | above normal |
| Percent of Normal = | Forecast RainfallNormal Rainfall | x 100% |
Month
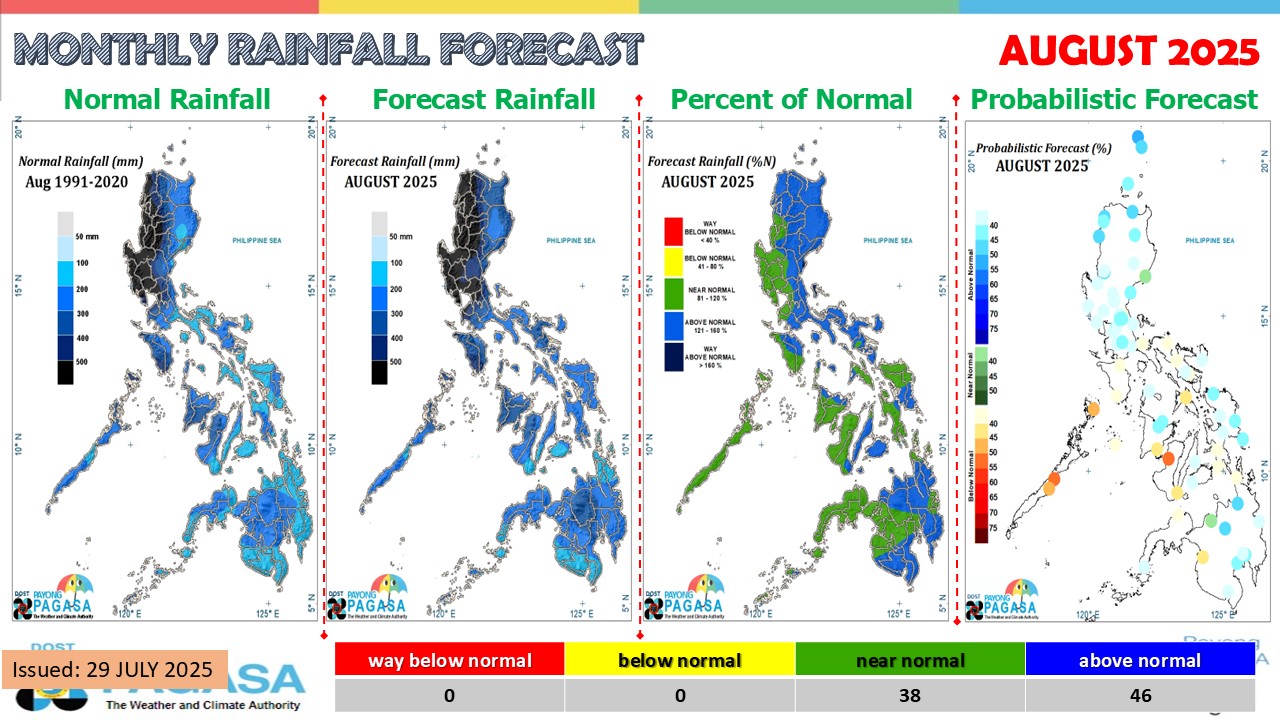
Forecast Rainfall Analysis
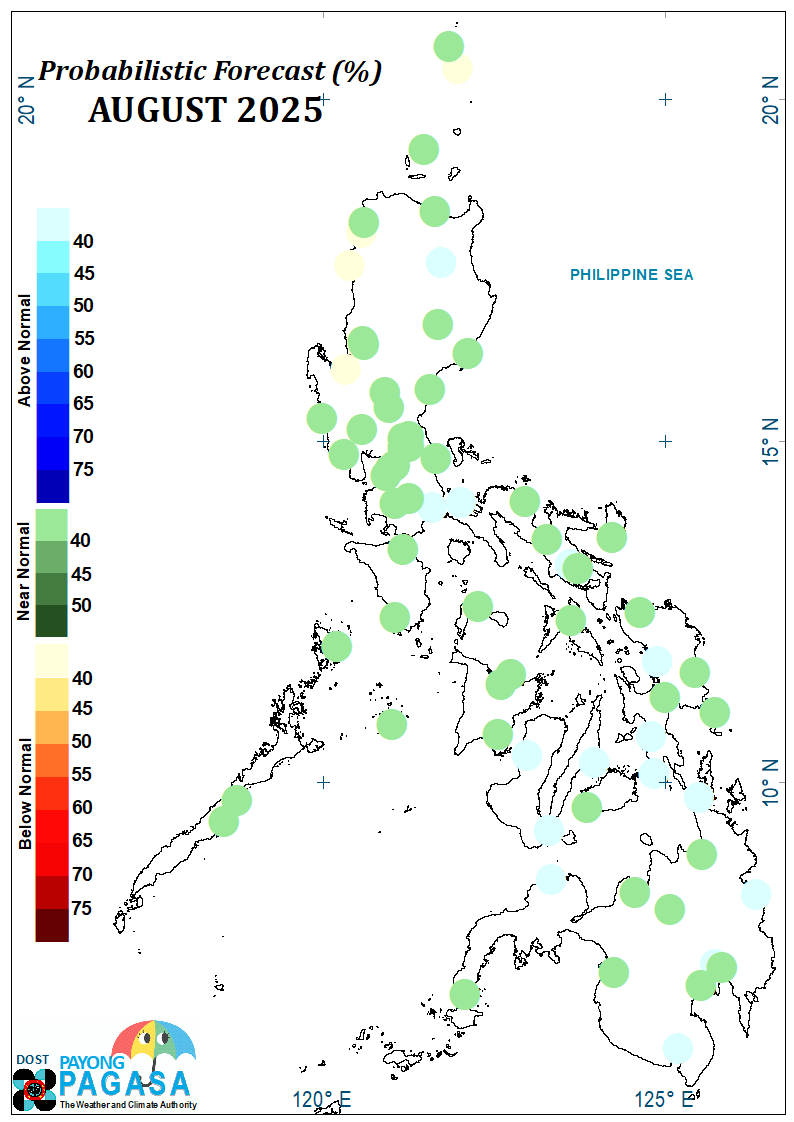
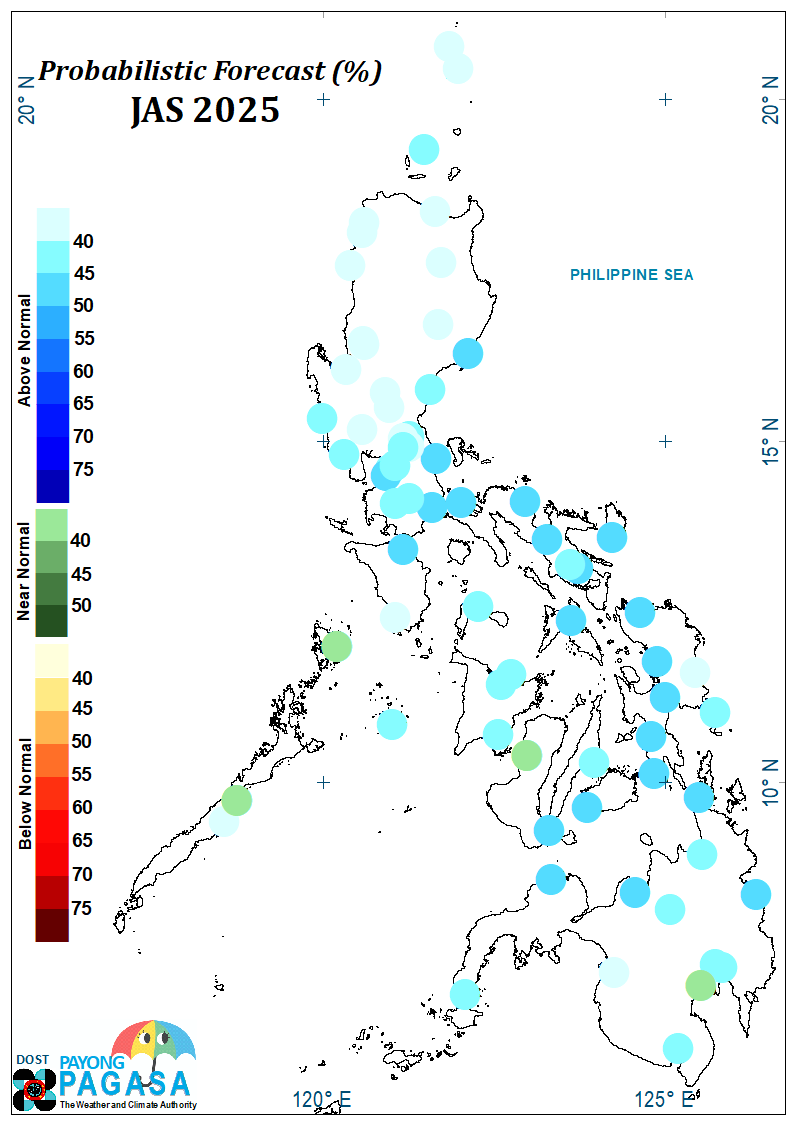
Probabilistic Rainfall Forecast
Forecasting rainfall or temperature in probabilistic terms is a way of expressing uncertainty in the future weather/climate. When numerical probability values are assigned to the forecast, it is a way of indicating the amount of uncertainty in the forecast. Rather than say "below normal this July", we can say "30% chance to be below normal this July" when we think less rain is not so likely; or we can say "70% chance to be above normal this July " when we think great amount of rain is likely. Assigning a numerical value – a probability – to the occurrence of rainfall event allows us to quantify the uncertainty.
A probability forecast estimates the likelihood of occurrence of a specific event, which must be fully defined for the forecast to be verifiable. Events are defined by a time period and a specific location.
Probabilities are usually stated either as a percentage, which may range from 0 ("The event will definitely not occur") to 100 ("The event will definitely occur"). Values between 0 and 100 represent the different degrees of uncertainty.
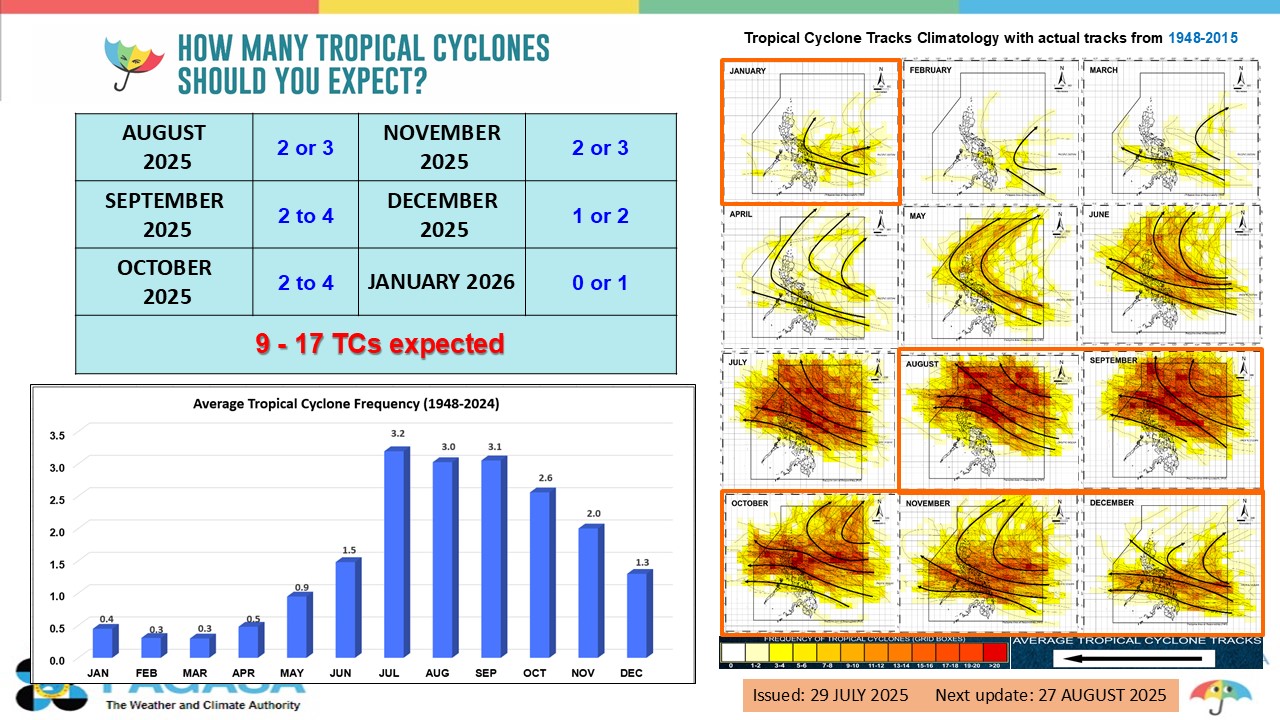
Seasonal
Month
A new forecast product that could be integrated by the agriculture sector in decision-making for the benefit of farmers and rice production in the country; Produced in the context of tailoring climate information for agricultural risk management applications;
Useful for other stakeholders (e.g., salt industry) for drying / and for agricultural produce predisposed to damage (post-harvest activities).
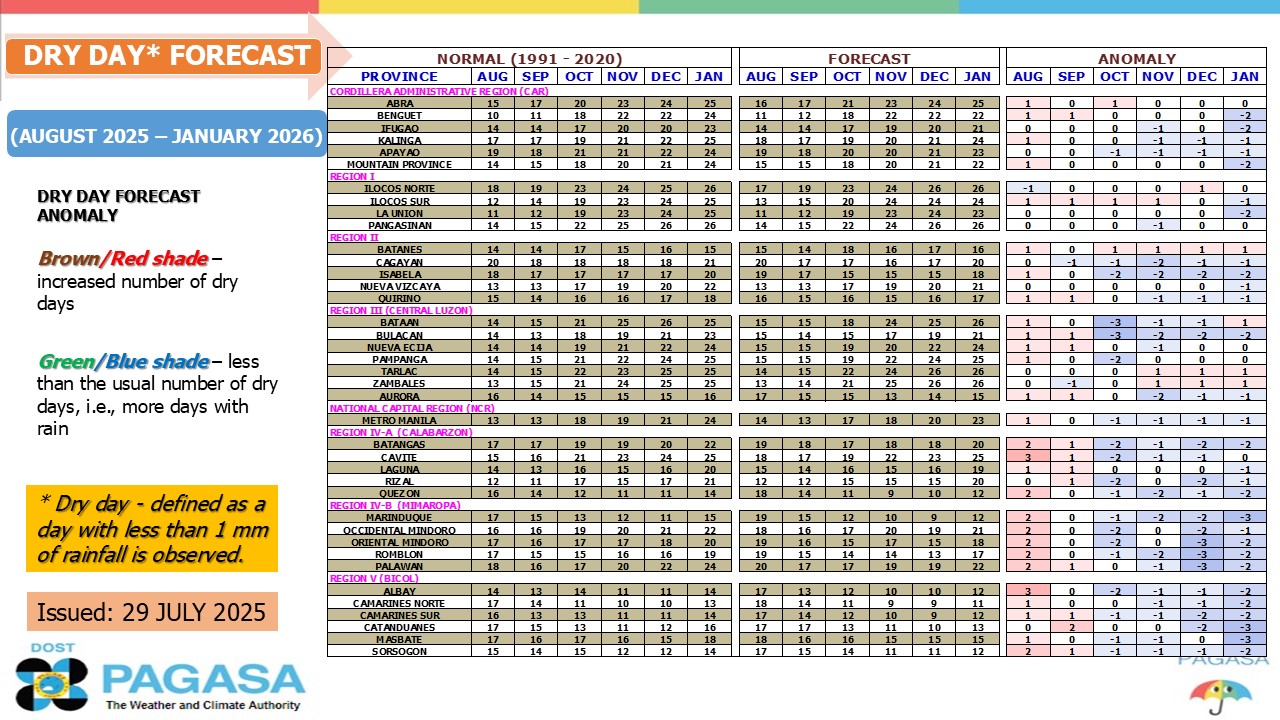
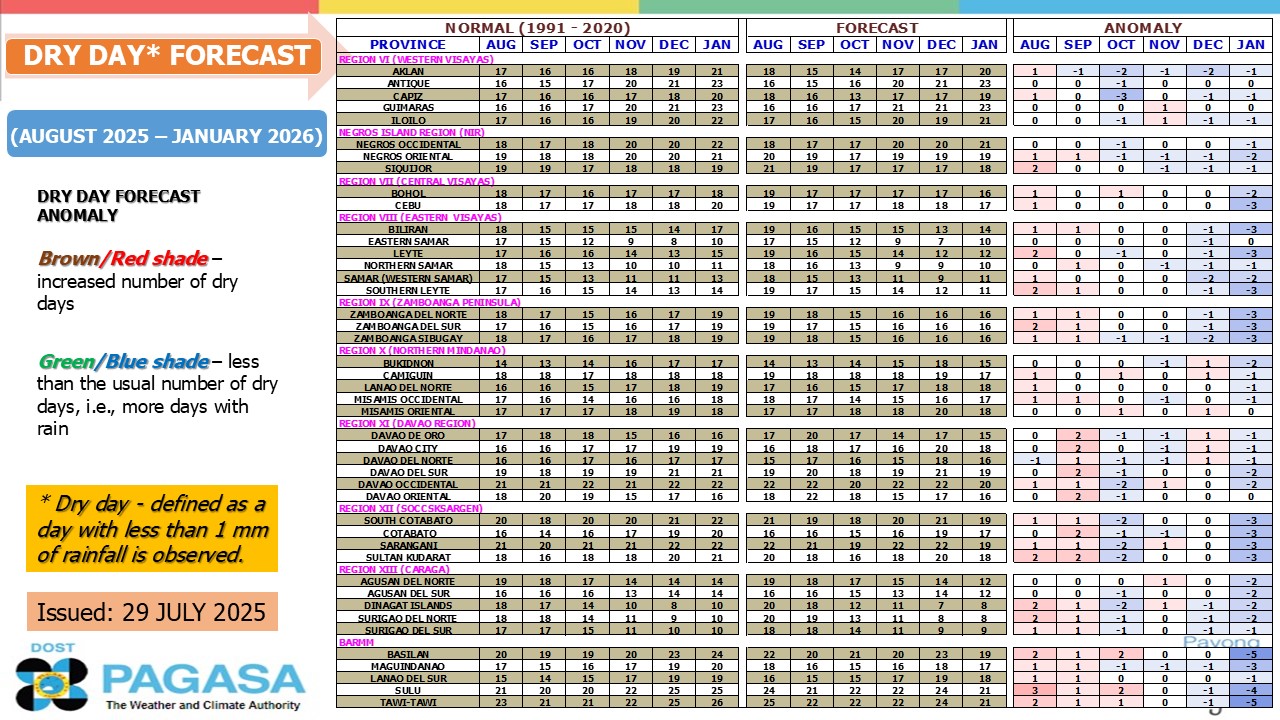
Dry day here is defined as a day with < 1 mm of rain (being issued February - April)
Wet day here is defined as a day with > or = 1 mm of rain (being issued May - January)